“Every one of those numbers sat underneath a single figure or a whole building average that told our client the building was performing just fine. Quality, room-level data made that building’s real fingerprint visible, and once they could see it, they could act on it proactively - before it became a complaint, or a cost. And that’s exactly what they did with us.”Chanel Turner-Ross, Marketing Director (Europe) at Utopi
The Challenge.
The operator’s Spanish portfolio was largely energy efficient, and in one building the whole-building average showed it performing well. Energy was a significant cost line and a key element of asset performance optimisation, but an average could not show what residents experienced in individual rooms.
The operator wanted to see beyond energy: How comfort, noise and air quality varied across the building, and how they could optimise operations in other areas.
Our Solution.
Utopi Multisensor™ room-level data feeds the Utopi Heatmap, which brings six environmental data points into one view of every room on every floor.

The same data that finds energy waste shows where comfort is slipping, room by room, early enough to act.
What the Data Showed.
Beneath the whole-building average, Utopi Multisensor™ data showed a clear fingerprint. None of it would appear on a utility bill, a main meter reading or a standard ESG audit.
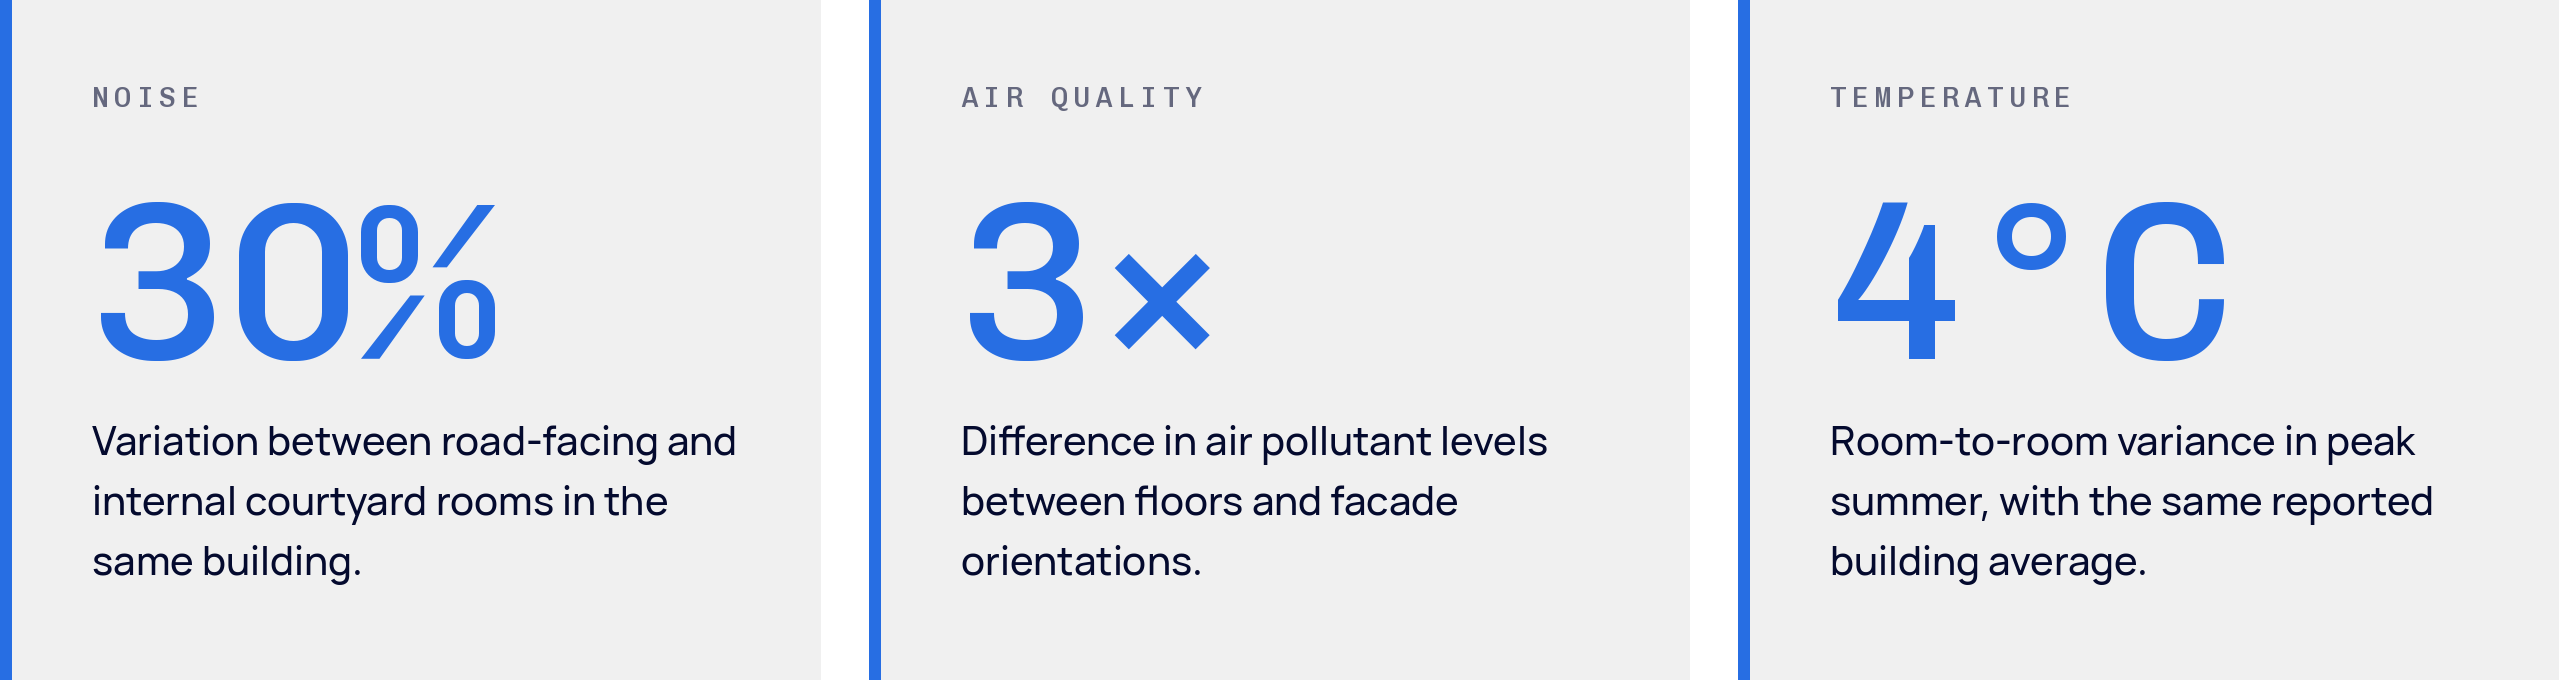
Across our European PBSA benchmark, 90-95% of rooms are occupied for at least five hours a day, and 20-40% for the full 10-hour active day. A resident in one of the warmest rooms spends long stretches of peak heat there.
Download the full Monthly Insights Report to see how the operator acted on these differences.
Actions.
During peak summer heat, the operator used the Utopi Heatmap in real time to spot upper-level rooms overheated above 24°C and to find cooler rooms sitting vacant. Residents were moved to those rooms before a single complaint was logged.
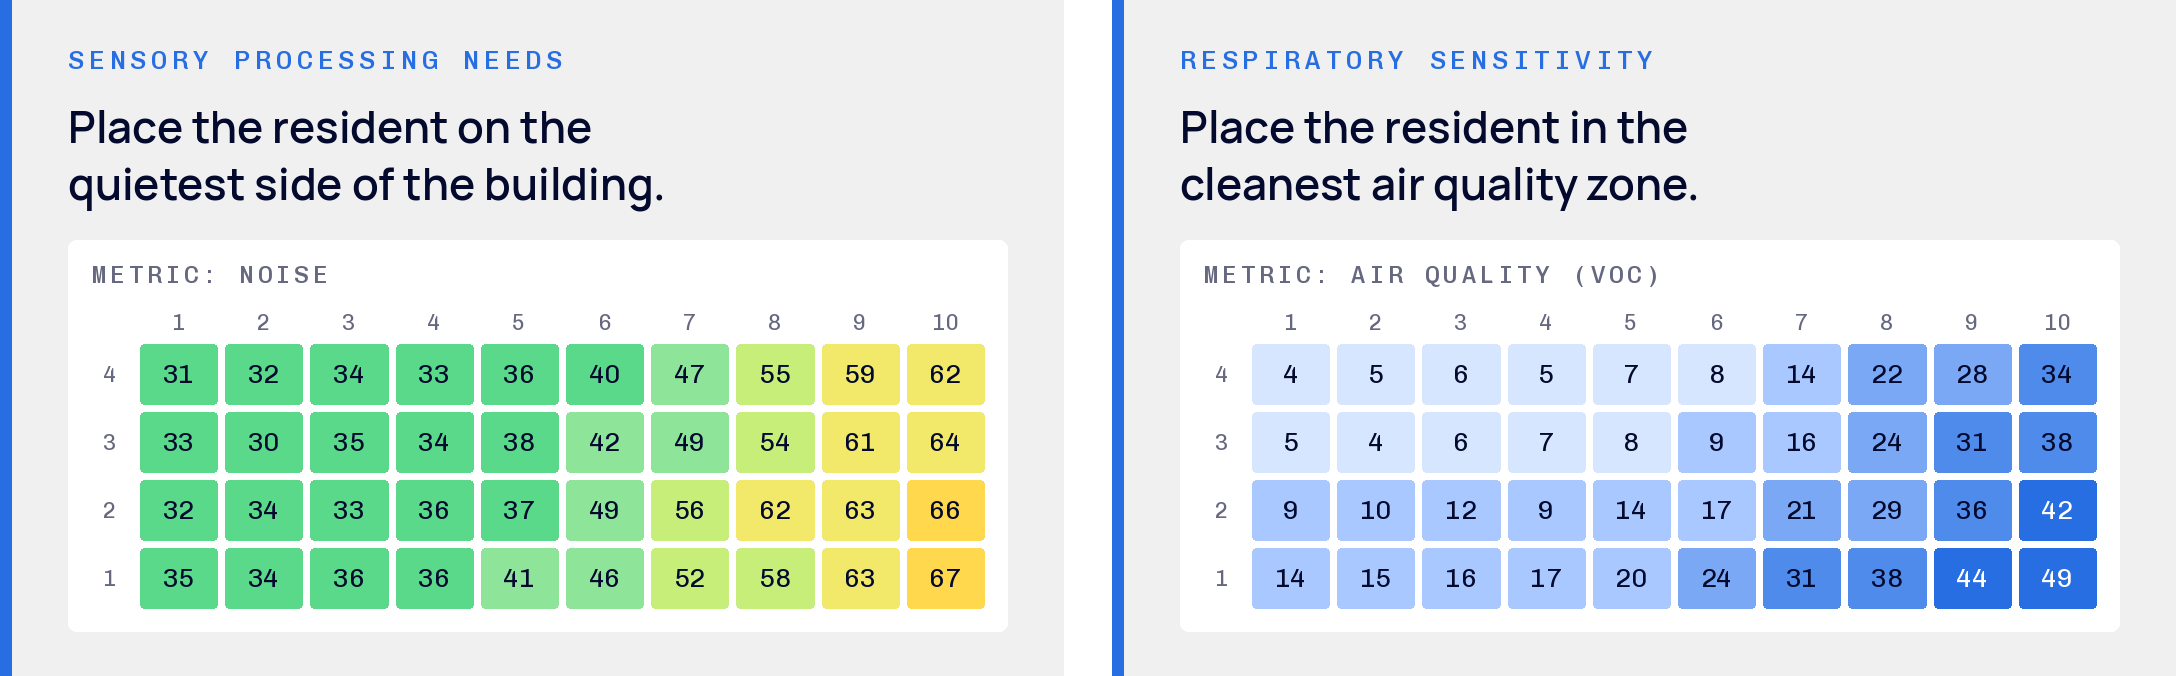
The same view supports placement. The heatmap shows which side of a building is quietest for residents with sensory processing needs, and where the air is cleanest for residents with respiratory sensitivity.
The Outcomes.
Resident satisfaction went up, and the energy spent overcooling those rooms went down.
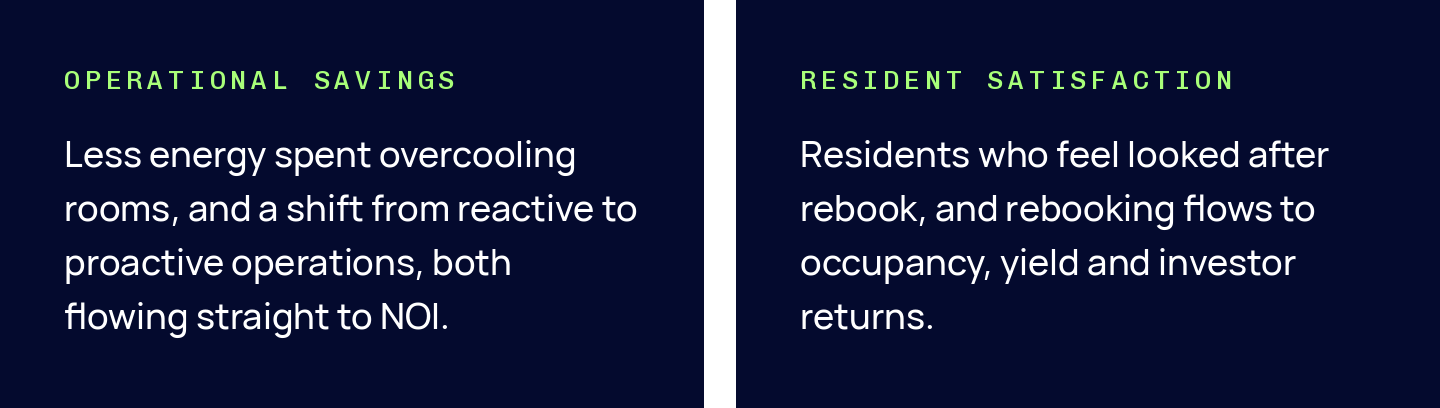
Understanding conditions at room level allows the operator to:
Act on comfort issues before a complaint is logged
Reduce energy spent overcooling rooms
Place residents by sensory and respiratory needs
Avoid room-change requests mid-term
Give investors verifiable evidence that performance is structural, not seasonal