
The Utopi Heatmap enables you to see what’s happening inside your building in real time. A near live dashboard, it tells you what conditions and usage is like in every room in your asset and is designed to enhance operational efficiency.
But what exactly is visible on the Utopi Heatmap Dashboard? And how does it align with resident wellbeing?
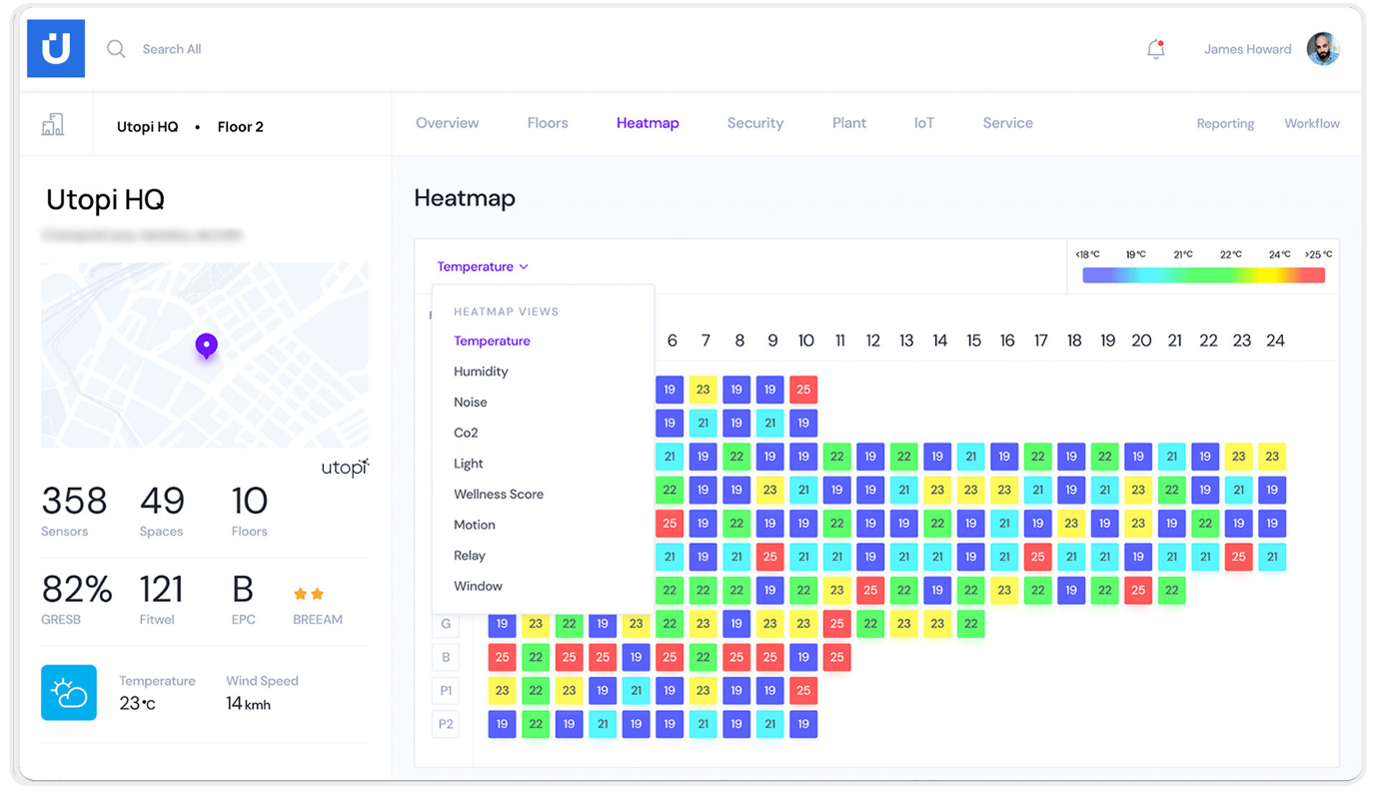
The Utopi Heatmap gives real-time access to temperature, humidity, noise, Co2, light and motion. Granular data, at your fingertips. Using a colouring system, it’s easy to spot which spaces are under or over the predicted measurement, allowing quick management of outliers in the data.
Let’s explore the connection between these features and core challenges in Resident Experience in greater detail:
1. Temperature and Humidity
Temperature and humidity levels can have a myriad of effects on resident experience and building performance. Excessive heat can be a signal of poor resident heating behaviours, or a malfunctioning heating system. Mould and moisture issues need to be tackled proactively, and without the kind of granular visibility possible with the Utopi Heatmap, it can be difficult to identify rooms not being properly heated, cooled and/or ventilated.
Resident Experience Impact:
- Residents are more comfortable and healthier in environments tailored to their needs.
- Site teams can address inefficiencies, such as poor ventilation and malfunctioning heating in real time, controlling operating costs while ensuring uninterrupted comfort.
Downing Students used the Utopi Heatmap in conjunction with Smart TRVs to control the heating in two PBSA assets and monitor outliers in the data to improve resident experience. Implementing Smart Temperature Controls resulted in improved resident comfort and reduced overheated spaces by an average of 52%.
2. Air Quality
Working on Net Promoter Scores? Indoor Air Quality (IAQ) policies will be key . The Utopi Heatmap gives clear, colour-coded sight of air quality in space-level detail and identifies potential patterns in air quality issues, such as inadequate ventilation or external pollutants entering the space. As air quality can have such negative effects on concentration, sleep, and mood; residents will feel the difference in their academic studies, improving rebooking numbers and overall satisfaction.
Resident Experience Impact:
- Clean, fresh air fosters well-being, reducing complaints and enhancing resident satisfaction and productivity.
- Residents feel safer knowing that indoor air quality is proactively managed, and having and enacting an IAQ policy is noted as a key tenant satisfaction opportunity in the QuadReal Benchmarking report.
Young people under 30 exposed to higher levels of air pollution can see a drop in cognitive function equal to aging 15 years. Particulate matter and other pollutants in household air pollution inflame the airways and lungs, impair immune response and reduce the oxygen-carrying capacity of the blood (WHO).
3. Noise and Light
Productivity and general wellbeing are a non-starter in a noisy, poorly lit environment. The Utopi Heatmap makes these areas of focus easy to spot in The Utopi Platform and therefore easy to tackle. The Utopi Multisensor can detect decibel levels in both shared and private spaces, easily identifying areas prone to noise pollution.
Resident Experience Impact:
- Quieter environments promote rest and focus, while optimised lighting reduces strain and supports circadian rhythms.
- A sense of control over these factors enhances the overall living experience for a resident.
Combined data analysis of PIR, light, and noise levels (available in the Utopi Heatmap) helped Utopi and Scotland Police track down a missing student. Using in-room insights, we could see they had pulled the blinds down and turned the heating off, signalling a chosen exit of the asset. This enabled swift intervention by the Police, and with airport CCTV confirming the student had safely returned home.
4. Occupancy and Movement Patterns
The interactive dashboard on the Utopi Heatmap means overheated spaces are quickly identifiable, and we know the inefficient use of space leads to higher energy bills and reduces the quality of communal areas. So, with the Utopi Heatmap showing heating patterns, it can highlight overused or underutilised spaces and in the context of underutilised spaces; it helps spot areas wasting unnecessary energy through heating.
Resident Experience Impact:
- Dynamic adjustment of resources, such as heating and lighting, lowers costs and ensures a better-shared environment.
- Enhanced safety monitoring supports peace of mind for both residents and operators.
The Utopi Heatmap revealed an unoccupied studio with temperatures soaring to 40°C, leading to the discovery of malfunctioning radiator valves causing continuous heating. Prompt intervention led to a temperature reduction of over 16°C resulting in potential savings of £480 over a 200-day heating season.
The Utopi Heatmap acts as a mediator between environmental data, resident satisfaction, and efficiency. Directly addressing common pain points like temperature, air quality, noise, and safety and acts as a single source of truth for reliable real-time data. With a clear dashboard and quick access to actionable insights, the Utopi Heatmap aids in creating an environment where residents feel valued, healthy, and safe.
Want to learn more? Speak to our expert team today.