
Scenario.
Our client operates four new-build student assets, 1,900 beds in total, all completed to a strong specification.
Before working with Utopi, building performance arrived as a single monthly total per asset, with no room-level view underneath it. That meant there was no visibility of which rooms were being heated while unoccupied, which were overheated, or what either behaviour was costing. Nothing looked wrong, because a whole building figure made it appear that at room level there was nothing to look at.
But there was more to understand under the surface: The heating ran consistently all season, and even when students went home for Christmas the buildings carried on exactly as before.
Resolution.
With granular, room-level data from Utopi Multisensors™, the operator could see every room individually for the first time, and assess performance across their portfolio.
The same two behaviours showed up across all four assets: Rooms heated while unoccupied, and rooms sitting above 24°C while occupied. Christmas proved the point. At one asset occupancy fell 45% and energy fell only 6%. At another occupancy fell 32% and energy rose 2%. The buildings kept heating to the same pattern with the rooms empty.
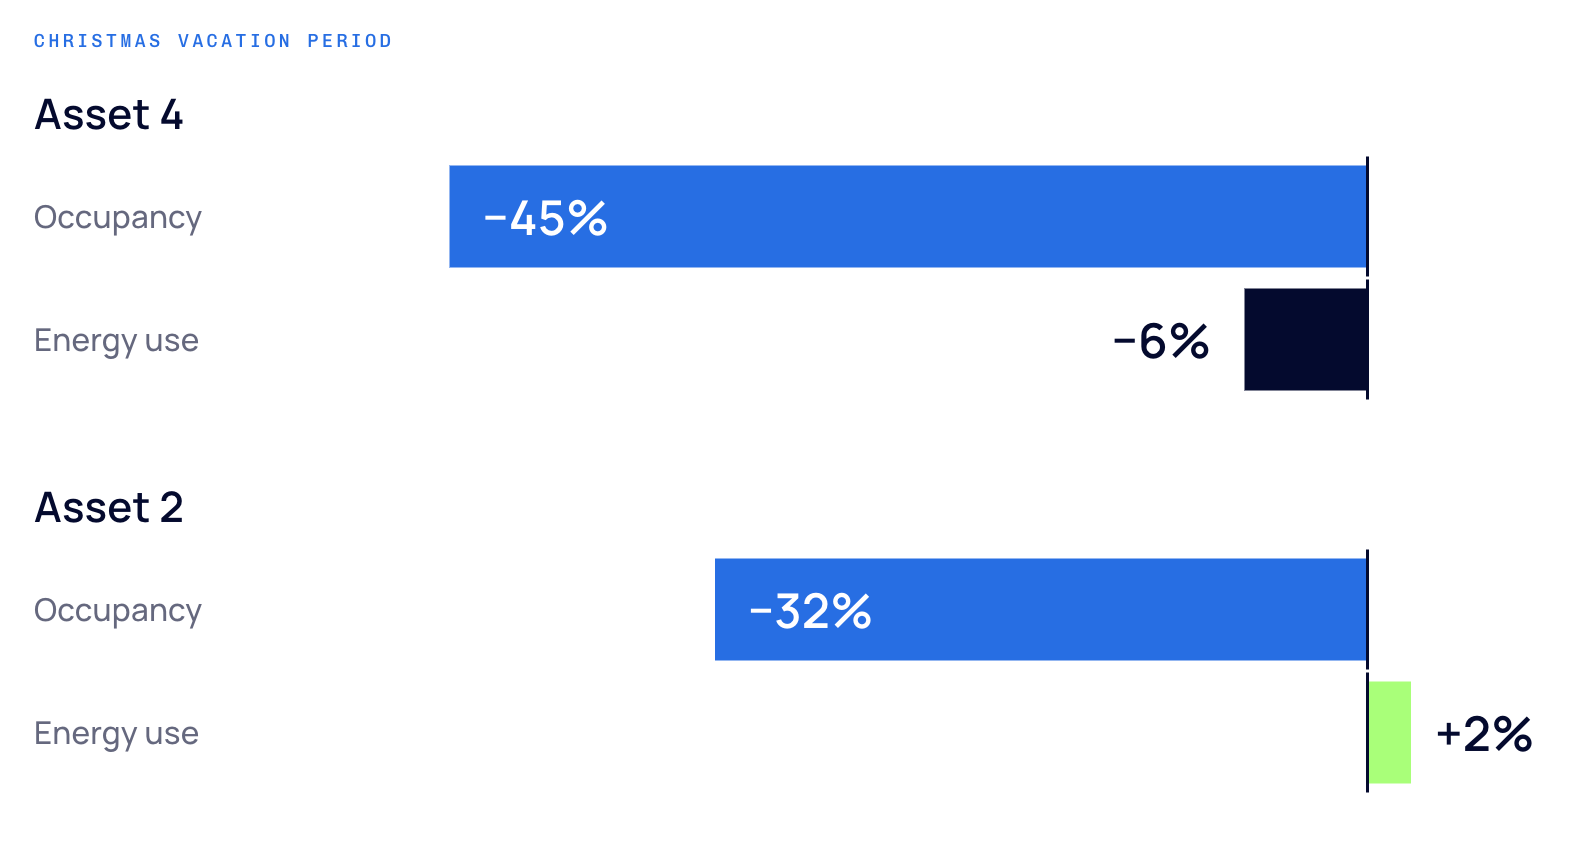
That put a measured figure on something previously invisible: £183,900 of measured recoverable waste in a single heating season, quantified per asset.
Utopi Data made an unknown into a quantified, addressable target that controls and operational settings can bring down.
Data.
Results across the 2025/26 heating season:
£183,900 recoverable Energy Cost waste across the portfolio
£97 per bed, per season
130.2 tCO2e Carbon Waste Detected